


Make Line Chart from CSV Data
For line drawing in this line chart creation program, we chose to use Make Anti-alias (Almost) Lines, but could have used Bresenham's Line Algorithm instead which is here (Make Anti-alias (Almost) Lines Using Bresenham's Line Algorithm) on our site.
JavaScript Charts, Graphs, Graphics, Circles, Ellipses, Arcs, Lines, and Polygons
Grab and Drop, Not Drag and Drop
Add Ids and onClicks to Divs
Add Ids and onClicks and Grab and Drop to Divs
Make Anti-alias (Almost) Lines
Make Anti-alias (Almost) Lines Using Bresenham's Line Algorithm
Good JavaScript Circle Algorithm
Good JavaScript Ellipse Algorithm
Good JavaScript Arc Algorithm
Make JavaScript Irregular Polygon
JavaScript Area of Irregular Polygon Algorithm
Make Line Chart from User-Inputted Data
Make Line Chart from CSV Data
Make Line Chart from MySQL Table Data
Make Bar Chart from User-Inputted Data
Make Bar Chart from CSV Data
Make Bar Chart from MySQL Table Data
Make Pie Chart from User-Inputted Data
Make Pie Chart from CSV Data
Make Pie Chart from MySQL Table Data
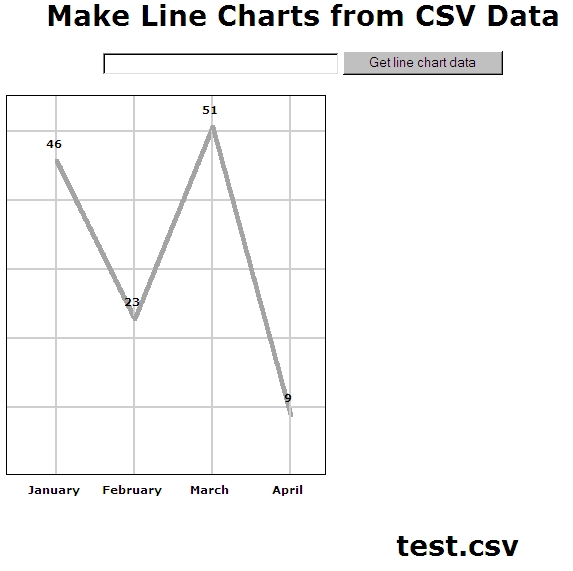
There are endless reasons to draw lines on browser screens. Our reason was to create line charts from CSV data although elsewhere we made a line chart with MySQL table data. We used a Pythagorean theorem-based algorithm below. However, as mentioned, we could have used the Bresenham's Line Algorithm instead in our line charts.
When considering line drawing algorithms, we chose to avoid jQuery and HTML5's Canvas since the former is unneeded and the latter has unsatisfactory support from browsers, and it's more fun just programming in straight JavaScript. There are JavaScript libraries around that have line routines, but you do not learn programming by cheating! And the same can be said for using filters and transforms which each browser does their own way—there's no standard—so this requires several different functions plus browser sniffing and IE dumped support for one method and supported another with little warning. (Note: even though you can use the PHP GD library functions to draw lines on images, since the line may cover the screen diagonally, this may mean creating an image as big as the screen, using up RAM memory like a wild man. Even though PHP programmers use the imagedestroy() function to clear the memory BEFORE the script ends, what if image creation itself runs you out of memory? If not, the imagedestroy() function is useful to keep memory usage DURING the script to an acceptable level.)
Data for line charts and graphs can come from any number of sources. We considered putting together a user input form and the numeric data could be charted and the non-numeric data turned into labels, and we did that here: Make Line Chart from User-Inputted Data. But we decided to also interface with the two most important database sources needing charting: CSV files and MySQL tables. CSV is a delimited data format that has fields/columns separated by the comma character and records/rows terminated by newlines, and MySQL is the most popular open-source database ever. The first, CSV, can be pulled out of any competant database app, for example: spreadsheets such as Microsoft Excel or databases such as Microsoft Access database or Apache OpenOffice, which is a spreadsheet, database, word processor, plus other stuff (and it's free). MySQL is a server-side relational database, and the tables that we store in this database can be easily created, modified, or just read with server-side computer languages—such as PHP. We'll read a MySQL table here: Make Line Chart from MySQL Table data, but on this page we'll stick to CSV files. Okay, let's look at some test data in Excel:
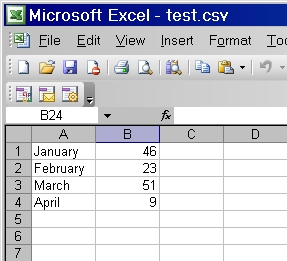
Now let's check out test data exported from Excel as a CSV file and stuck in a text editor:

And you can, of course, simply type comma-separated data into your text editor if you're too lazy to make an Excel file. But we used Excel. Excel can make lots better graphs than what we'll do here, but if you like programming as much as we do, you'd like to check out how it's done. Besides, what if you've created a PHP poll but do not feel like dealing with the script for making a chart, but you do want a bar chart or line chart?
Get the CSV file in the same folder on the server as the PHP program below called Make Line Charts from CSV Data, which you may copy from this page and name as a PHP file called getcsvtolinechart.php.
When creating your CSV file or Excel file that you'll export as CSV, remember to type in a word like the name of a month and then an amount that must be a number. Don't add $ or other things—if you need it to be about money, have this in your CSV name, such as Monthly Data in Dollars Collected From Selling Pottery. If you'd like to add a $ filter so that you can deal with exported Excel data with $ in front of it, that's simple programming we'll leave up to you to add that to the PHP program below.
After some simple CSS to style the page so it looks good, we code the bDiv DIV which we use for both the month labels and the amount labels. We'll be adding these labels to the document with DOM methods like createElement() and appendChild(), using innerHTML for inserting the actual text into the DIV. We'll use calculated top and marginLeft properties on this DIV later. Note that the overflow property is hidden and the background-color is transparent so in case you decide to have longer labels, the text won't slobber all over nearby text.
Next, there's a little form whose action is the PHP file getcsvtolinechart.php, which is the name you need to give the PHP file on this page. In other words, once you type in the file name, such as test.csv, the web page calls itself, reloading but remembering the POSTed file name.
Next comes the PHP script. We POST in the file name and check to see if there is such a file in your folder on the server. Next comes the file_exists() function which checks whether or not a file or directory exists. This function returns TRUE if the file or directory exists, otherwise it returns FALSE and the page reloads. If true, the script goes on to declare the $month and $amount arrays and it uses the fopen() function to open the file it found. Next, in a while() loop, we use the fgetcsv() function to parse a line from an open file, checking for CSV fields. Once it runs out of new lines to parse, it registers FALSE and we close the file.
While in the loop, we use the array_push() function to get the CSV file's data into our two arrays. Then, in order to know how to arrange the
web page, we need to know the maximum value found in the $amount array. We use the max() function for this purpose. Next comes the line drawing script, which is JavaScript, because even though the PHP GD library can draw lines, we prefer the JavaScript way—why tax the server when the browser can do the job client-side just fine?
In the line drawing script, the function goodline() first gets its variables declared. Next the hypotenuse length is put into the lengthofline variable, using good old Pythagorus. (The formula gets the square root of the sum of the squares of two adjacent sides.) Next, we define a for loop where we go from one end (of the line we're drawing) to the other, a pixel at a time, plotting divs on each line pixel. So, technically, given two points we find the length of the line between two given points and then a variation on slope-intercept form and point-slope form equations is used to plot each point of the line. The line is not quite a line with anti-aliased smoothness, but this technique using a 4x4 grey-background-colored div is the next best thing. The addtopage variable has all those divs added to it and now we add one more thing: a vertical line that will be right above one of the Month labels and going to the top of the chart, intersecting a
point where two lines meet and the Amount label is later inserted. Finally, we use the innerHTML() function to put the two lines on the page. Where does the xx[q] number for the left style position of the vertical line come from? You'll see below.
Now come JavaScript Object Notation (JSON) for PHP to JavaScript conversions. We use the json_encode() function to convert the month names array and the amount array and the biggest amount number and the CSV file name into JavaScript array and variables, respectively, for convenient use. Then we declare xx and yy as arrays. Then we get a factor (r) to divide each amount by, after which we subtract all this from 497 (bottom y edge of graph) to get a y value to end a line at. Next we get ll, the actual number of characters in the highest amount. E.g., the amount 555 would make ll=3. Next we get 0.01 as the value of factor (still using 555 as an example), using the Math.pow() method. Next we get 500 (still using 555 as an example) as the value of num which is the highest value where there will be a horizontal line. There will be 5 horizontal lines added. They will be at y values corresponding to the amount values 100, 200, 300, 400, and 500.
Next we get fac=100 by use of Math.pow(10,ll-1), so we have the lowest value where there will be a horizontal line. Now we use the variable firstint to hold num/fac which is 5—the number of horizontal graph grid lines. And next we use variable dd to hold num/b which is 0.9009. Then we get 63 when we use the variable o to hold Math.round((350*dd)/firstint). So this 63 is the distance apart of each horizontal line. The 350 is the height of the graph minus 30—which we did because we don't want an amount label in the graph or a line end to hit the top of the graph. Only the vertical grid lines are allowed to touch the top.
Next we use the Document Object Model (DOM) in a for loop to add lines to the page. We use the createElement() Method to bring a div into existence and the appendChild() Method to get it integrated into the document. The innerHTML property is used to put the line divs into the div elements.
Next we test the a and the m arrays—if both have lengths greater than 0, we go on. Otherwise we jump to the end of the script and do nothing. This ensures the CSV file had some data to graph. Now comes a for loop in which we put values in the xx and yy arrays. But since i starts at 0, the first amount line start (also the vertical line x coordinate) is at xx[i]=59. The next xx[i] value is at 137, which is 78+59, and so on, with each new line starting 78 horizontal pixels right of the last. The factor r is used to divide each amount (a[i]) by, after which we subtract all this from 497 (bottom y edge of graph) to get a y value to end a line at. We use if(i>0) before running the line routine because we are drawing lines from A to B, and when i is 0, we know only the A but not the B so where would we draw such a line TO? And so the "else" is that we do nothing but draw the vertical line at x=59 right now. But if i > 0 we run the line routine, packing it with 4 parameter values: goodline(xx[i-1], xx[i], yy[i-1], yy[i]);. This is all the data needed for A and B, above, which we're just using here to say one line's start point to the next line's start point.
We've already talked about the line routine, goodline(), which draws a 4-pixel-thick line representing amount fluctuations and then draws a vertical line as a graph grid line. The for loop that runs this function several times continues until the last line is drawn. However, there are 3 more things to do: the month labels, the amount labels, and the box around the entire line chart.
Starting with the month labels, we use the Document Object Model (DOM) in a for loop to add month labels to the page. We use createElement() and appendChild() DOM functions. Note the calculated marginLeft property and the innerHTML() method to get the label into the new div.
We do the same thing with the amount labels: we use the Document Object Model (DOM) in a for loop to add amount labels to the page. We use createElement() and appendChild() DOM functions. Note the calculated marginLeft property and top property and the innerHTML() method to get the label into the new div.
Finally, we put the CSV file name as a big title under the graph and we draw a box around the whole graph using a width forced by the width and min-width properties.
<html>
<head>
<!DOCTYPE html PUBLIC "-//W3C//DTD HTML 4.01 Transitional//EN">
<META HTTP-EQUIV="Content-Type" CONTENT="text/html; charset=windows-1252">
<TITLE>Make Line Charts from CSV Data</TITLE>
<meta name="description" content="Make Line Charts from CSV Data">
<meta name="keywords" content="Make Line Charts from CSV Data,View CSV Data as Line Charts,line chart CSV Data,php,javascript, dhtml, DHTML">
<STYLE TYPE="text/css">
BODY {margin-left:0; margin-right:0; margin-top:0;text-align:left;}
p, li, td {font:13px Verdana; color:black;text-align:left}
h1 {font:bold 28px Verdana; color:black;text-align:center}
h2 {font:bold 24px Verdana;text-align:center}
h3 {font:bold 15px Verdana;}
#myid {position:absolute;left:10px;top:117px;height:380px;border: solid 1px #000;}
#myform {position:absolute;left:50px;top:20px}
#label {position:absolute;left:400px;top:550px;}
.bDiv {
width: 76px;
border: none;
background-color: transparent;
font-size: 11px;
font-weight: bold;
font-family: verdana;
color: #000;
padding: 5px;
overflow:hidden
}
</STYLE>
</head>
<body>
<div id='myform'>
<center><h1>Make Line Charts from CSV Data</h1></center>
<form action='getcsvtolinechart.php' method='post' name='sendname'>
<center><input type='text' name='table' id='whattable' size='35' maxlength='40' value=''>
<input type='submit' value='Get line chart data' name='flag'></center></form></div>
<?php
$table=$_POST['table'];$t=$table; if(strlen($t) > 0){
IF (!FILE_EXISTS($t)){echo '<script language="javascript">alert("No such file.");window.location="getcsvtolinechart.php";</script>;';}else
{$row = 1;$month=array();$amount=array();
if (($handle = fopen($t, "r")) !== FALSE) {
while (($data = fgetcsv($handle, 1000, ",")) !== FALSE) {
$num = count($data);
$row++;
array_push ($month, $data[0]);
array_push ($amount, $data[1]);}
$biggest=max($amount);}
fclose($handle);
}}
?>
<script language="javascript">
var xa, xb, ya, yb, x, y; var addtopage = "";
function goodline(xa, xb, ya, yb) {
var lengthofline = Math.sqrt((xa-xb)*(xa-xb)+(ya-yb)*(ya-yb));
for(var i=0; i<lengthofline; i++){
x=Math.round(xa+(xb-xa)*i/lengthofline);
y=Math.round(ya+(yb-ya)*i/lengthofline);
addtopage += "<div style='position:absolute;left:"+x+"px;top:"+y+"px;background-color:#a4a4a4;width:4px;height:4px;font-size:1px'></div>";}
addtopage += "<div style='position:absolute;left:"+xx[q]+"px;top:117px;'><IMG SRC='vert.gif' WIDTH=2 HEIGHT=380 BORDER=0></div>";
document.body.innerHTML += addtopage;}
var m = <?php echo json_encode($month); ?>;
var a = <?php echo json_encode($amount); ?>;
var b = <?php echo json_encode($biggest); ?>;
var t = <?php echo json_encode($t); ?>;
var r=b/350;var xx = new Array();var yy = new Array();
var ll=(b.toString()).length;
var factor=Math.pow(10,-1*(ll-1));
var num=(Math.floor(b*factor)/factor);
var fac=Math.pow(10,ll-1);
var firstint=num/fac;
var dd=num/b;
var o=Math.round((350*dd)/firstint); //497y start then go up (y less) for each tic
for (var i=firstint;i>0;i--){
var divTag = document.createElement("div");
divTag.id="a" + i;
divTag.style.marginLeft = 10+"px";
divTag.style.position = "absolute";
divTag.style.top = (497-o*(firstint-(firstint-i)))+"px";
divTag.style.height = 2+"px";
divTag.innerHTML = "<IMG SRC='hor.gif' WIDTH='"+(a.length*80)+"' HEIGHT='2' BORDER='0'>";
document.body.appendChild(divTag);
}
if (a.length > 0 && m.length > 0) {
for (var i=0;i<a.length;i++){q=i;
xx[i]=i*78+59;
yy[i]=497-(a[i]/r);
if(i>0){goodline(xx[i-1], xx[i], yy[i-1], yy[i]);}else{addtopage += "<div style='position:absolute;left:"+xx[q]+"px;top:117px;'><IMG SRC='vert.gif' WIDTH=2 HEIGHT=380 BORDER=0></div>";}
}
for (var i=0;i<a.length;i++){
var divTag = document.createElement("div");
divTag.id="b" + i;
divTag.setAttribute("align", "center");
divTag.style.marginLeft = (i*78+20)+"px";
divTag.style.position = "absolute";
divTag.style.top = 500+"px";
divTag.style.height = 22+"px";
divTag.className = "bDiv";
divTag.innerHTML = m[i];
document.body.appendChild(divTag);
}
for (var i=0;i<a.length;i++){
var divTag = document.createElement("div");
divTag.id="c" + i;
divTag.setAttribute("align", "center");
divTag.style.marginLeft = (i*78+20)+"px";
divTag.style.position = "absolute";
divTag.style.top = (470-(a[i]/r))+"px";
divTag.style.height = 22+"px";
divTag.className = "bDiv";
divTag.innerHTML = a[i];
document.body.appendChild(divTag);
}
document.write("<div id='label'><h1>"+t+"</h1></div><div id='myid' style='min-width:"+(a.length*80)+"px; width:"+(a.length*80)+"px'> </div>");
}
</script>
</body>
</html>