


Make Pie Chart from CSV Data
For line drawing in this pie chart creation program, we chose to use Bresenham's Line Algorithm, which is here Make Anti-alias (Almost) Lines Using Bresenham's Line Algorithm) on our site. But we could have used Make Anti-alias (Almost) Lines instead.
JavaScript Charts, Graphs, Graphics, Circles, Ellipses, Arcs, Lines, and Polygons
Grab and Drop, Not Drag and Drop
Add Ids and onClicks to Divs
Add Ids and onClicks and Grab and Drop to Divs
Make Anti-alias (Almost) Lines
Make Anti-alias (Almost) Lines Using Bresenham's Line Algorithm
Good JavaScript Circle Algorithm
Good JavaScript Ellipse Algorithm
Good JavaScript Arc Algorithm
Make JavaScript Irregular Polygon
JavaScript Area of Irregular Polygon Algorithm
Make Line Chart from User-Inputted Data
Make Line Chart from CSV Data
Make Line Chart from MySQL Table Data
Make Bar Chart from User-Inputted Data
Make Bar Chart from CSV Data
Make Bar Chart from MySQL Table Data
Make Pie Chart from User-Inputted Data
Make Pie Chart from CSV Data
Make Pie Chart from MySQL Table Data

Pie Chart made from CSV Data
There are endless reasons to draw lines on browser screens. Our reason was to create pie charts from CSV data although elsewhere we made a pie chart with Make Pie Chart from MySQL Table Data, and we also used user-inputted data to create pie charts: Make Pie Chart from User-Inputted Data. We used the Bresenham's Line Algorithm for the line drawing in our pie charts.
When considering line drawing algorithms for the pie chart, we chose to avoid jQuery and HTML5's Canvas since the former is unneeded and the latter has unsatisfactory support from browsers, and it's more fun just programming in straight JavaScript. There are JavaScript libraries around that have line routines, but you do not learn programming by cheating! And the same can be said for using filters and transforms which each browser does their own way—there's no standard—so this requires several different functions plus browser or object or function sniffing and IE dumped support for one method and supported another with little warning. (Note: even though you can use the PHP GD library functions to draw lines on images, since the line may cover the screen diagonally, this may mean creating an image as big as the screen, using up RAM memory like a wild man. Even though PHP programmers use the imagedestroy() function to clear the memory BEFORE the script ends, what if image creation itself runs you out of memory? If not, the imagedestroy() function is useful to keep memory usage DURING the script to an acceptable level.)
Data for pie charts and graphs can come from any number of sources. We considered putting together a user input form and the numeric data could be charted and the non-numeric data turned into labels, and we did that here: Make Pie Chart from User-Inputted Data. But we decided to also interface with the two most important database sources needing charting: CSV files and MySQL tables. CSV is a delimited data format that has fields/columns separated by the comma character and records/rows terminated by newlines, and MySQL is the most popular open-source database ever. The first, CSV, can be pulled out of any competant database app, for example: spreadsheets such as Microsoft Excel or databases such as Microsoft Access database or Apache OpenOffice, which is a spreadsheet, database, word processor, plus other stuff (and it's free). MySQL is a server-side relational database, and the tables that we store in this database can be easily created, modified, or just read with server-side computer languages—such as PHP. We'll read a MySQL table here: Make Pie Chart from MySQL table data, but on this page we'll stick to CSV files. Okay, let's look at some test data in Excel:
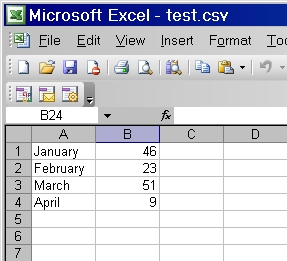
Now let's check out test data exported from Excel as a CSV file and stuck in a text editor:

And you can, of course, simply type comma-separated data into your text editor if you're too lazy to make an Excel file. But we used Excel. Excel can make lots better graphs than what we'll do here, but if you like programming as much as we do, you'd like to check out how it's done. Besides, what if you've created a PHP poll but do not feel like dealing with the script for making a chart, but you do want a bar chart or line chart?
Get the CSV file in the same folder on the server as the PHP program below called Make Pie Charts from CSV Data, which you may copy from this page and name as a PHP file called Make-Pie-Charts-from-CSV-Data.php.
When creating your CSV file or Excel file that you'll export as CSV, remember to type in a word like the name of a month and then an amount that must be a number. Don't add $ or other things—if you need it to be about money, have this in your CSV name, such as Monthly Data in Dollars Collected From Selling Pottery. If you'd like to add a $ filter so that you can deal with exported Excel data with $ in front of it, that's simple programming we'll leave up to you to add that to the PHP program below.
After some simple CSS to style the page so it looks good, we code the grab and drop script. The Grab and Drop, Not Drag and Drop script lets you adjust the positions of your labels onscreen. It requires the script to constantly monitor cursor position.
After some simple CSS to style the divs to be grabbed, we define the variables we'll need for the grab and drop. Next we have the JavaScript function check(). It is called from inside the div we want to move. The code says: if the div we clicked is being carried, we drop it. But if the div we clicked is not being carried, we pick it up. The flag variable is 1 if the div is getting carried and 0 if it is not. It's set up as an on-off switch. The q variable is where the id of the div goes, or "iii" if we haven't grabbed one.
And next we have the function getCoords() run off the onload event in the body tag. The traditional event registration model is used to force the mouse coordinate getting function every time we move the mouse. Note the absence of () after getCoords. Calling the function needs () but registering which event fires
getCoords() requires you NOT to use ().
The getCoords() function itself is mostly the standard coordinate reader, which uses different properties depending on the browser, but instead of browser sniffing we check for object support. The clientX event attribute returns the horizontal coordinate (according to the client area) of the mouse pointer when an event was triggered. The client area is the current window. The clientY event attribute returns the vertical coordinate (according to the client area) of the mouse pointer when an event was triggered. The pageX property returns the position of the mouse pointer, relative to the left edge of the document. The pageY property sets or returns the y-coordinate of the mouse pointer relative to the top-left corner of the browser window's client area. The scrollTop property sets or retrieves the number of pixels by which the contents of an object are scrolled upward. The scrollLeft property sets or retrieves the number of pixels by which the contents of an object are scrolled to the left.
We use the getElementById() method to access the div element with the id of the div we clicked on. Then we alter the div's left and top properties to be the cursor's minus 5 pixels. This latter is because when we later drop the div, the cursor's click must be ON the div, not just off its top corner.
Now the JavaScript function get_xxx_yyy() figures label positions based on many factors. It is assumed you'll still need to adjust a few labels with the grab and drop function, which is automatically available once the pie chart is done. Next the function trimit() ensures no label is over 12 characters long.
Next comes the function goodline(), which draws all the pie chart lines—720 radius lines from the circle center to the perimeter. And each radius line is about 100 pixels long, so that is a lot of line pixels. Had we made the circle 220 pixels wide instead of 200 pixels, IE8 would have stopped before it got to the end of the line drawing because only around 135,000 divs are allowed on a page and 200 wide circle filling requires nearly that many. It's not that there are that many pixels in the circle—it's just that as one draws lines from the outside perimeter to the circle's center, more and more overlapping occurs in which you're placing divs over divs.
The function goodline() first defines 25 different line colors and puts these in the colors[] array. Then all labels are run through the trimit() function. Next, after defining some variables we total all the amount data and put it into the variable called total. Then we figure out how many lines we'll draw for each amount data, and this goes into the data2[] array. But we change the data in this array to something more helpful: which of the 720 perimeter pixels of the circle will start each new line color. We add i%2 to these calculations, which is Modulus (division remainder) to add 1 to the data2[] values when i is odd and add 0 when it is even. This makes up for the fact that the arithmetic necessarily is integer (since div positions have to be on integer-based coordinates, with no decimal numbers to increase precision), so it does not have the precision of floating point. Without this incrementing on every other i value, the 720 lines (radii) will quit drawing before the circle is 100% filled—settling for 99%, which looks bad.
Then we start a for loop for drawing the 720 Bresenham's Line Algorithm lines from the perimeter to the center of the circle. In the loop, we check if we've gotten to a perimeter pixel where it is time for the next color by comparing i and data2[k]. Since k started at 0, and data2[k] is initially which of the 720 perimeter pixels will be the first color change location, as soon as we get to this point, we increment k to prepare to check the next location in the data2[] array.
Then the xxx and yyy variables, which get the results of figuring label positions, are calculated. We will look at xxx only—yyy is done similarly. So the xxx=Math.round(Math.abs(xl-xl2)/2) code gets half the difference between the current color change perimeter pixel and the last one. This is either added or substracted to xxx, depending on how far around the circle perimeter we've gotten. If the last color change perimeter pixel is left of the current one, we add this xxx midpoint to the current color change perimeter pixel location, otherwise it is added to the last one. We run the get_xxx_yyy() function now to fine-tune the label position, which sometimes needs further adjustment via our grab and drop routine. What should be obvious here is that we want labels to be centered next to pie slices, not at the start or end of the color change where one pie slice ends and the next one begins. Okay?
We now adjust for the fact that the values for xxx, the horizontal label coordinate, are fine if xxx>500 (the circle center), but if not, they'll be representing where the right edge of the label should end, since the label is to the left of the circle center. We want label starting coordinate, not ending coordinate. We get the label length and multiply by 6 (average pixels per character width) and add this to xxx, because the get_xxx_yyy() function defaulted to starting horizontal label positions at 100 pixels left of the circle edge, which means short labels would be too far left of the pie.
Now we create the label div. It has 'grab' as its class and onclick as its event and j as its id. The j variable contains the letter i and a unique number so it ends up as "i3" or something like it. The onclick event gets check() as its function which gets j as its argument. Note the \ escaping characters allowing two quotes in a row without befuddling the browser. We need the id (e.g., "i3") in quotes, but also needed to get the value of j between the quotes. And onclick='check(\""+j+"\")' does the job. Note the lines in the circle, the circle itself, and the labels all go into the variable addtopage, which gets added to the page later with innerHTML. And the actual labels in the labels[] array came from the PHP script on this page which read a CSV file in PHP and then we converted the array into a JavaScript array with JavaScript Object Notation (JSON) for PHP to JavaScript Conversions. See below.
So far we have dealt with labels, but we must draw the actual lines now, using Bresenham's Line Algorithm, which will draw lines from the perimeter to the center of the circle, one point (in this case a 2x2 div) at a time. So xmiddle and ymiddle represent the center of the pie. The xx[] and yy[] arrays have the 720 circle perimeter coordinates figured in our circle() function. It runs before the goodline() function and saves these coordinates as it figures them out from a circle algorithm in circle(). The 2x2 divs are added to addtopage, and the routine keeps on until the end of the line is reached, which is detected with: if (x0 === xmiddle && y0 === ymiddle) break; which breaks us out of the line loop.
The circle routine is based on a common circle algorithm except most speed the draw by using 360 instead of 720 in all three of the instances you find it in the circle() function. This 720 is not really needed very badly with a smaller circle like this, but with circles twice as big (400 pixels wide rather than 200 pixels wide like in this pie chart script), you'll get gaps without it. In Good JavaScript Circle Algorithm we use a 3x3 div and it looks great, but in our pie charts we use a 5x5 div, which looks better and the inside pixels get covered by lines so it ends up as 3x3 anyway. The circle() function ends by calling the goodline() function.
Now we run into a "please wait....calculating" message script that displays a message while the pie is being built. Upon completion, the message goes away. The form discussed below has on onsubmit event that runs the setup_timer() function, which runs a routine to display the message and then a routine to stop displaying it. The 'tooltip' id is the id of the message div, and using DHTML to change the CSS display property from none to block to none is all that's required. We need the message because the pie creation takes a few seconds to draw the circle and then fill it with 720 lines.
Note that the body tag has an onload event that runs the startmouse() script. Next, there's a little form whose action is the PHP file Make-Pie-Charts-from-CSV-Data.php, the one whose source code is on this page. It is the name you need to give the PHP file on this page. In other words, once you type in the CSV file name, such as test.csv, the web page calls itself, reloading but remembering the POSTed file name. The form has two submit buttons. One says 'Get pie chart data w/o border' and the other says 'Get pie chart data'. The form runs the page we are on. The onsubmit='setup_timer()' code gets the message going.
Next comes the PHP script. We POST in the file name and check to see if there is such a file in your folder on the server. Next comes the file_exists() function which checks whether or not a file or directory exists. This function returns TRUE if the file or directory exists, otherwise it returns FALSE and the page reloads. If true, the script goes on to declare the $labels and $data arrays and it uses the fopen() function to open the file it found. Next, in a while() loop, we use the fgetcsv() function to parse a line from an open file, checking for CSV fields. Once it runs out of new lines to parse, it registers FALSE and we close the file.
While in the loop, we use the array_push() function to get the CSV file's data into our two arrays. Next comes the line drawing script, which is JavaScript, because even though the PHP GD library can draw lines, we prefer the JavaScript way—why tax the server when the browser can do the job client-side just fine?
Next comes the div with the 'tooltip' id and the message. Note that its display property starts out as none—it will stay that way until form submission.
Now come JavaScript Object Notation (JSON) for PHP to JavaScript conversions. We use the json_encode() function to convert the PHP data and labels arrays and $bd flag and the CSV file name into JavaScript arrays and variables, respectively, for convenient use. Then we run the circle() function and use the document.write() function to put the CSV file name under the pie chart as the chart name.
<html>
<head>
<!DOCTYPE html PUBLIC "-//W3C//DTD HTML 4.01 Transitional//EN">
<META HTTP-EQUIV="Content-Type" CONTENT="text/html; charset=windows-1252">
<TITLE>Make Pie Charts from CSV Data</TITLE>
<meta name="description" content="Make Pie Charts from CSV Data">
<meta name="keywords" content="Make Pie Charts from CSV Data,View CSV Data as Pie Charts,pie chart CSV Data,php,javascript, dhtml, DHTML">
<STYLE TYPE="text/css">
BODY {margin-left:0; margin-right:0; margin-top:0;text-align:left;}
p, li, td {font:13px Verdana; color:black;text-align:left}
h1 {font:bold 28px Verdana; color:black;text-align:center}
h2 {font:bold 24px Verdana;text-align:center}
h3 {font:bold 15px Verdana;}
#myform {position:absolute;left:50px;top:20px}
#label {position:absolute;left:400px;top:550px;}
.grab {position:absolute;font-size:15px;font-weight:bold;color:black;}
</style>
<script type="text/javascript">
var q="iii";//which one is grabbed--if none, this is "iii"
var flag=0;//if one is grabbed--if none, this is 0
var bi,x,y,xq,yq;
var addtopage='';
function check(bi) {
if(flag==1){flag=0;q="iii";return;}
if(q=="iii"&&flag==0){flag=1;q=bi;}}
function startmouse() {document.onmousemove=getCoords;}
function getCoords(e){
if (!e) var e = window.event;
if (e.pageX){xq = e.pageX;yq = e.pageY;} else if
(e.clientX){xq = e.clientX + document.body.scrollLeft;yq = e.clientY + document.body.scrollTop;}
if(flag==1&&q!="iii"){var myDiv=document.getElementById(q);myDiv.style.left=(xq-5)+'px';myDiv.style.top=(yq-5)+'px';}
}
var radius,xmiddle,ymiddle;
var xxx=0;var yyy=0;
var xlast = -1;
var ylast = -1;
var yy = new Array();
var xx = new Array();
var labels = new Array();
var data = new Array();
var t;
var s = null;
var timer_on = false;
var bd=0;
function get_xxx_yyy(){
yyy=yyy-10;
if(xxx>=500){
if(yyy<310&&yyy>=290){xxx=617;}
if(yyy<330&&yyy>=310){xxx=608;}
if(yyy<345&&yyy>=330){xxx=602;}
if(yyy<360&&yyy>=345){xxx=592;}
if(yyy<370&&yyy>=360){xxx=576;yyy=yyy+10;}
if(yyy<380&&yyy>=370){xxx=563;yyy=yyy+10;}
if(yyy<390&&yyy>=380){xxx=550;yyy=yyy+10;}
if(yyy>=390){xxx=500;yyy=yyy+10;}
if(yyy<290&&yyy>=270){xxx=605;}
if(yyy<270&&yyy>=255){xxx=597;}
if(yyy<255&&yyy>=240){xxx=594;}
if(yyy<240&&yyy>=230){xxx=591;}
if(yyy<230&&yyy>=220){xxx=585;yyy=yyy-5;}
if(yyy<220&&yyy>=210&&xxx>=541){xxx=560;yyy=yyy-10;}
if(yyy<220&&xxx>=540){xxx=560;yyy=yyy-10;}
if(yyy<220&&xxx<540){xxx=540;yyy=yyy-10;}
if(yyy<210&&xxx<540){xxx=500;yyy=yyy-15;}
if(yyy<210&&xxx>=540){xxx=499;yyy=yyy-15;}
}
else{
if(yyy<310&&yyy>=290){xxx=300;}
if(yyy<330&&yyy>=310){xxx=307;}
if(yyy<345&&yyy>=330){xxx=315;}
if(yyy<360&&yyy>=345){xxx=325;}
if(yyy<370&&yyy>=360){xxx=335;yyy=yyy+10;}
if(yyy<380&&yyy>=370){xxx=342;yyy=yyy+10;}
if(yyy<390&&yyy>=380){xxx=390;yyy=yyy+10;}
if(yyy>=390){xxx=380;yyy=yyy+5;}
if(yyy<290&&yyy>=270){xxx=300;}
if(yyy<270&&yyy>=255){xxx=290;}
if(yyy<255&&yyy>=240){xxx=290;}
if(yyy<240&&yyy>=230){xxx=300;yyy=yyy-10;}
if(yyy<230&&yyy>=220){xxx=322;yyy=yyy-10;}
if(yyy<220&&yyy>=210&&xxx>=461){xxx=400;yyy=yyy-15;}
if(yyy<220&&xxx<460){xxx=335;yyy=yyy-10;}
if(yyy<210&&xxx>=460){xxx=414;yyy=yyy-25;}
}
return true;
}
function trimit(lll){lll = lll.substring(0, 12);return lll;}
function goodline(xmiddle,ymiddle,xx,yy,data,labels) {
var colors = new Array('#f00','#ff0','#f0f','#0f0','#0ff','#00f','#f88',
'#88f','#8f8','#888','#f80','#ff8','#f8f','#8f0','#8ff','#80f','#fcc','#ccf',
'#cfc','#ccc','#f0c','#ffc','#fcf','#cf0','#cff','#c0f','#fc8','#c8f','#cf8','#c88');
for(var i = 0;i < labels.length; i++){labels[i]=trimit(labels[i]);}
var data2 = new Array();
L=data.length; var ii=0; var total=0; var k=0; var xl=500;var yl=400; var xl2=500;var yl2=400;
while(ii<L){total=total+parseInt(data[ii]);ii++;}
for(var i = 0;i < L; i++){data2[i]=parseInt((data[i]/total)*720);}
for(var i = 0;i < L; i++){if(i>0){data2[i]=data2[i]+data2[i-1]+(i%2);}}
data2[L-1]=720;
for (var i = 0; i <=720; i++) {
if(i==data2[k]){
k++;
if(i==data2[k-1]){xl=xl2;yl=yl2;
xl2=xx[i];yl2=yy[i];
xxx=Math.round(Math.abs(xl-xl2)/2);
yyy=Math.round(Math.abs(yl-yl2)/2);
if(xl>xl2){xxx=xl2+xxx;}else{xxx=xl+xxx;}
if(yl>yl2){yyy=yl2+yyy;}else{yyy=yl+yyy;}
get_xxx_yyy();
if(xxx<500){var llen=labels[k-1].length;xxx=xxx+6*(12-llen);}
var j="i"+(k-1).toString();
addtopage += "<div class='grab' id='"+j+"' onclick='check(\""+j+"\")' style='position:absolute;left:"+xxx+"px;top:"+yyy+"px;font-size:15px;font-weight:bold;'>"+labels[k-1]+"</div>";
}
}
var x0=xx[i];var y0=yy[i];
var dx = Math.abs(xmiddle - x0), sx = x0 < xmiddle ? 1 : -1;
var dy = Math.abs(ymiddle - y0), sy = y0 < ymiddle ? 1 : -1;
var err = (dx>dy ? dx : -dy)/2;
while (true) {
addtopage += "<div style='position:absolute;left:"+x0+"px;top:"+y0+"px;background-color:"+colors[k]+";width:2px;height:2px;font-size:1px'></div>";
if (x0 === xmiddle && y0 === ymiddle) break;
var e2 = err;
if (e2 > -dx) { err -= dy; x0 += sx; }
if (e2 < dy) { err += dx; y0 += sy; }
}
}
document.body.innerHTML += addtopage;
}
function circle(radius,xmiddle,ymiddle,bd){
for (var i = 0; i <= 720; i++) {
x = parseInt(xmiddle+(radius*Math.sin(i*2*(Math.PI/720)))+0.5);
y = parseInt(ymiddle+(radius*Math.cos(i*2*(Math.PI/720)))+0.5);
xx[i]=x;yy[i]=y;
if (xlast != x || ylast != y){
xlast = x;ylast = y;
if(bd==1){addtopage += "<div style='position:absolute;left:"+(x-2)+"px;top:"+(y-2)+"px'><IMG SRC='anti3.gif' WIDTH=5 HEIGHT=5 BORDER=0></div>";}
}}
goodline(xmiddle,ymiddle,xx,yy,data,labels);
}
function setup_timer(){t=7;stopcounter();start_timer();}
function stopcounter(){
document.getElementById('tooltip').style.display='block';
if(timer_on){clearTimeout(s);}
timer_on=false;}
function start_timer(){
if (t==0){stopcounter();bye();}
else {t=t-1;timer_on=true;
s=self.setTimeout("start_timer()",1000);}}
function bye(){document.getElementById('tooltip').style.display = 'none';}
</script>
</head>
<body onload="startmouse()">
<?php
$table=$_POST['table'];
if (isset($_POST['flag'])){$bd=0;}else{$bd=1;}
$t=$table; if(strlen($t) > 0){
IF (!FILE_EXISTS($t)){echo '<script language="javascript">alert("No such file.");window.location="Make-Pie-Charts-from-CSV-Data.php";</script>';}else
{$row = 1;$labels=array();$data=array();
if (($handle = fopen($t, "r")) !== FALSE) {
while (($mydata = fgetcsv($handle, 1000, ",")) !== FALSE) {
$num = count($mydata);
$row++;
array_push ($labels, $mydata[0]);
array_push ($data, $mydata[1]);}
}
fclose($handle);
}}
?>
<div id='myform'>
<center><h2>Make Pie Charts from CSV Data (with Grab-and-Drop Labels)</h2>Click label to grab it. Move it with mouse. Click to drop it. Do not hold down mouse button to drag labels.</center>
<form action='Make-Pie-Charts-from-CSV-Data.php' method='post' name='sendname' onsubmit='setup_timer()'>
<center><input type='text' name='table' id='whattable' size='35' maxlength='40' value=''>
<input type='submit' value='Get pie chart data' name='flag1'> <input type='submit' value='Get pie chart data w/o border' name='flag'></center></form></div>
<div id='tooltip' style='display:none;background-color:#ccc;border:1px solid black;z-index:99;position:absolute;left:250px;top:200px;width:350px;padding:10px'>
<p><b>please wait....calculating</b><BR></p></div>
<script type="text/javascript">
var labels = <?php echo json_encode($labels); ?>;
var data = <?php echo json_encode($data); ?>;
var t = <?php echo json_encode($t); ?>;
var bd = <?php echo json_encode($bd); ?>;
if (labels.length > 0 && data.length > 0) {
circle(100,500,300,bd);
document.write("<div id='label'><h1>"+t+"</h1></div>");
}
</script>
</body>
</html>