


JavaScript Charts, Graphs, Graphics, Circles, Ellipses, Arcs, Lines, and Polygons
In this overview, we will see why JavaScript may or may not be a good fit for the tasks of creating Charts, Graphs, Graphics, Circles, Ellipses, Arcs, Lines, and Polygons. One can do this stuff without JavaScript. But it cannot be denied that it is fun to do these scripts, regardless of the fact that there is no desperate need for them. One reason to code these scripts is because good JavaScript scripts that handle the tasks below are few and far between. We are referring to just plain JavaScript here, not JavaScript libraries and frameworks or jQuery, many of which can handle tasks like those that are mentioned below quite easily. So in early 2013, there were no plain JavaScript scripts that created ellipses (none that Google found, even though we found C scripts for most shapes). The JavaScript circle scripts we found had lots of gaps in their lines. No JavaScript scripts that created polygons also gave the area—our script lets you select vertices with mouse clicks. No JavaScript scripts that created arcs were findable—with ours you choose any degree angle between 1 and 360 in a dropdown.
When it comes to charts, there were free and not free JavaScript scripts libraries that created them. See: Comparison of JavaScript frameworks. Or see Dojo Toolkit or Raphael. A JavaScript graphics library is a collection of API used to aid in the creation of graphics for either the HTML5 canvas element or SVG (Scalable Vector Graphics). Most graphic libraries are APIs in name and function. An application programming interface (API) is a protocol intended to be used as an interface by software components to communicate with each other. An API is a library that may include specification for routines, data structures, object classes, and variables. An API specification can take many forms.
But suppose you do not want prepackaged libraries or frameworks or APIs, but instead want to learn to perform the graphics tasks listed below with plain old JavaScript. You're curious how it can be done. We sure were, as you can see below!
JavaScript Charts, Graphs, Graphics, Circles, Ellipses, Arcs, Lines, and Polygons
Grab and Drop, Not Drag and Drop
Add Ids and onClicks to Divs
Add Ids and onClicks and Grab and Drop to Divs
Make Anti-alias (Almost) Lines
Make Anti-alias (Almost) Lines Using Bresenham's Line Algorithm
Good JavaScript Circle Algorithm
Good JavaScript Ellipse Algorithm
Good JavaScript Arc Algorithm
Make JavaScript Irregular Polygon
JavaScript Area of Irregular Polygon Algorithm
Make Line Chart from User-Inputted Data
Make Line Chart from CSV Data
Make Line Chart from MySQL Table Data
Make Bar Chart from User-Inputted Data
Make Bar Chart from CSV Data
Make Bar Chart from MySQL Table Data
Make Pie Chart from User-Inputted Data
Make Pie Chart from CSV Data
Make Pie Chart from MySQL Table Data
In the beginning the 2 Steves created the Apple II and the personal computer phenomenon. Now, the earth was computerless and empty of Internet at the time, but the genesis of an incredible transformation was begun which would soon be all over the surface of the earth, and the Spirit of the 2 Steves was hovering over the planet. They said: "let the transformation begin!" And it was so.
And the 2 Steves said, “Let there be personal computers everywhere,” and there were personal computers everywhere. The 2 Steves, one a creative engineer and inventor, the other a high-tech visionary, saw that the personal computers were good, and they separated the light from the darkness when one turned on the monitor screen. “Let there be light,” they said, and there was light. The 2 Steves called the light “pixels” and the darkness they called “shut-down.” And the 2 Steves saw that their Apple II was good—so good they named a company after it. (Or vice-versa.)
And the rest (PCs, Macs, iPhones, iPods, iPads), as they say, is history. We all know it. And the world will never be the same.
JavaScript is one of the most popular programming languages on the web. JavaScript is an interpreted computer programming language which was created as part of web browsers so that client-side scripts could interact with the website visitors, as well as control the browser, communicate asynchronously with Ajax (Asynchronous JavaScript and XML), and change the page content that was displayed. Professional programmers rejected the language at first because its target audience was web authors and other such people who they thought of as "amateurs." But the advent of Ajax returned JavaScript to the spotlight and brought more professional programming attention. The result was a proliferation of comprehensive frameworks and libraries. These JavaScript libraries and JavaScript frameworks changed attitudes toward JavaScript, happily. Examples of popular frameworks: jQuery and Dojo. Example of libraries focusing on graphics: CanvasJS HTML5 Charts, D3.js, and Raphael. There are dozens of JavaScript Libraries, only a small portion of which focus on graphics.
There are hundreds of computer programming languages. JavaScript (JS) was released in the mid-90s as a client-side language for browsers. PHP, on the other hand, is a server-side scripting language designed for web development but also used as a general-purpose programming language. PHP code is interpreted by a web server with a PHP processor module which generates the resulting web page. You can draw with PHP, using the GD Library. Drawing with PHP and drawing with JavaScript are both a bit awkward compared to drawing in BASIC (Beginner's All-purpose Symbolic Instruction Code) where you can do hplot x,y for points and hplot to x,y and hplot x,y to xx,yy for lines, in general terms. Or use commands like context.arc(100,100,50,0,Math.PI*2,true) in specific Canvas terms for a single point. The HTML5 canvas element is used to draw graphics, on the fly, via scripting (usually JavaScript). The canvas element is only a container for graphics. You must use a script to actually draw the graphics. Canvas has several methods for drawing paths, boxes, circles, characters, and adding images. A circle example in HTML5:
<canvas id="myCanvas" width="200" height="100"></canvas>
<script>
var c=document.getElementById("myCanvas");
var ctx=c.getContext("2d");
ctx.beginPath();
ctx.arc(95,50,40,0,2*Math.PI);
ctx.stroke();
</script>
A circle example in JavaScript in HTML4:
function circle(radius,xmiddle,ymiddle,bd){
for (var i = 0; i <= 720; i++) {
x = parseInt(xmiddle+(radius*Math.sin(i*2*(Math.PI/720)))+0.5);
y = parseInt(ymiddle+(radius*Math.cos(i*2*(Math.PI/720)))+0.5);
xx[i]=x;yy[i]=y;
if (xlast != x || ylast != y){
xlast = x;ylast = y;
addtopage += "<div style='position:absolute;left:"+(x-2)+"px;top:"+(y-2)+"px'><IMG SRC='anti3.gif' WIDTH=5 HEIGHT=5 BORDER=0></div>";}}}
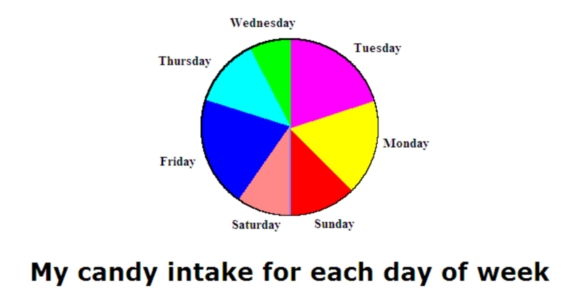
As you can see, this method of using Canvas with JavaScript is faster and easier than drawing points as 5x5 divs, using a circle formula, one div at a time, in our Good JavaScript Circle Algorithm. Additionally, for filling circles, once you get to 135,000 divs on a page, IE8 refuses to draw more. The 135,000 divs is about one filled circle 200 pixels wide, where 2x2 pixels are used for filling, because even though IE8 made good pie charts using 1x1 divs for filling, the other browsers didn't, so we used 2x2 for all browsers. (The other browsers incompletely filled the circle with 1x1 divs, for some reason.) Note: the script above is just an UNFILLED circle. For a filled one like the one in the picture above, we need 720 radius lines drawn, with each div in the 100-pixel-long radius lines drawn one div (one point) at a time. By the way, the xx[i]=x;yy[i]=y; stuff is just us saving the circle perimeter points in arrays, since they're vital for the drawing of the 720 radius lines which will fill the circle like in the picture above. Omit this line if you want only an UNfilled circle.
When the Apple II, PET 2001 and TRS-80 were all released in 1977, all three had BASIC as their primary programming language and operating environment. In the late 1970s, Applesoft BASIC could draw points and lines using hplot commands, on a screen whose resolution was 280 x 192 (pixels). IBM PC started with 320 wide screens. People often used regular TVs at first with adaptors, for monitors, but later used computer monitors. Once people conquered BASIC, they learned assembler, the best being LISA. This allowed them to write direct to the algorithms on the chips, which were in the computer RAM at specific addresses. This bypassed the BASIC interpreter and speeded operations way up. Apple IIs has two sections of memory dedicated to hi-res screens, each 8192 bytes long. For animation you'd switch between these rapidly, updating one screen while displaying the other. The worst part of these screens is that the screen memory was not sequential, but somewhat scrambled, creating challenges for programmers. The computer processor speed was 1 megahertz, not 3000 megahertz (3 GHz), like today. But this sufficed to create fast database searches, effective animation, and a hell of a lot of fun. Thank you, 2 Steves! Having been in on this consumer-level computer revolution from the beginning (1979, when Apple II Plus sales took off), we can testify about what an exciting time it was!
Fast forward to 2013, when computers have graphics cards, graphics accelerators, great screen resolutions, 1 terrabyte hard drives, 4 gigabytes of RAM, 3 GHz processors, etc. (Apple II with 64K bytes had only about 47K useable for programming, and the drives had 5¼-inch Disk II floppy disks holding 113K at first; later it was 140K.)
Since Canvas has no point drawing command, people use workarounds like: ctx.fillRect(2,1,1,1). With plain JavaScript and no libraries, frameworks, or APIs, one has to created a div with either a colored background or a 1x1 gif image in it. IE8 allows about 135,000 of these before it stops drawing, refusing to go on—at least it does not crash! Firefox allows more divs. On the other hand, Canvas has convenient and fast graphics shapes available with few limits. JavaScript itself has no shapes except rectangles (bordered or unbordered divs) unless libraries or frameworks are employed or you use the one div/point at a time method we use. (Of course, websites can simply include JPB, BMP, GIF, or PNG graphics shapes like circles, squares, etc., on their pages and this precludes the necessity of drawing anything.)
It will be a long time before programmers can legitimately expect a given user's browser to support Canvas, because IE8 and below will never support it. Browser 'news says that "Roughly 56% use IE-based browsers [Jan. 2013], with the percentage changing little. About 22% use IE9, 24% IE8, 2% IE7, and 7% IE6, with the IE6-IE8 percentages dropping as users upgrade to IE9 and IE10: IE7 users are more willing to update than IE6 users, so IE7 usage is dropping faster than IE6 usage. IE9 usage is growing slowly, impaired by its failure to support Windows XP." But w3schools.com says only 13.5% use ANY IE at all at their site—which draws more sophisticated users. However, as long as a third of the users have IE8 or less, Canvas support expectations will be naive. Of course, Microsoft being what they are, instead of showing a willingness to update IE8 so it supports Canvas or update IE9 so it runs on XP, uses nag screens on tons of websites that come up and shame users for having obsolete browser versions like IE8, and then telling them some features may screw up because of not updating to IE9. This would mean buying Windows 7 or 8 since XPs cannot run IE9, even though all other browsers' most recent versions support XP just fine. This all feels like extortion to us, "buy this new OS or suffer our harassment", and we resent it, as do millions of others. This is surely a great way to get people to dump IE altogether and head for Chrome or Firefox, both of which have fine support for XP, HTML5, and Canvas! Some website features are gone when you use IE8 rather than IE9: Dailymotion.com's hover-based video previews, which Chrome and Firefox support fine. Microsoft lawyers: note we said it FEELS LIKE extortion, not that it IS extortion. You cannot sue a person for feeling something! Anyway, Microsoft, here is some great advice: take a hint from millions of angry XP users (who LIKE XP, by the way) and stop the harassment and start letting IE9 run on XP, already!
Computer graphics have been around since just before 1960. Starting with the consumer computing revolution in the 1980s, people have loved to draw and create on computers, using Design Your Own types of software, such as Design Your Own Home, which eventually transmogrified into Ez-Architect type programs that are around today in 2013 and run on the latest OSes. But there is a balance between creativity and consumption. Play a game or make one? Draw a picture or find one? Buy software or make your own by learning to program? Create a video or view others' videos? People love to use software to create designs, using Design Your Own types of software. But people also enjoy looking at designs others created. But people also like programming their own Design Your Own types of software. And still others like to design the computers for software to run on. So think of Steve Wozniac designing a computer and then we buy it and design Design Your Own types of software, and a person buys this software and designs a floorplan with it which he then shows to a contractor who builds a house with it. The contractor depends on the software designer who depends on the computer designer who in turn depends on the computer chip designer. So the contractor depends ultimately on a company such as Intel to make the computer chip to get this wave of creativity rolling.
Are you a doer or a watcher? A lover of consumption or a lover of creativity? Or do you, like so many of us, prefer PROSUMPTION, in which you creatively produce something (a YouTube video, for example) from a camera you consumed (purchased), or buy Design Your Own types of software and then create a useful design, or create a Design Your Own software program from a computer you consumed from Apple or Dell or HP? There needs to be a balance between using prepackaged/store-bought or building/programming/growing/creating your own. As a prosumer, you create (produce) the video with the camera but then put it on YouTube where you and your friends have a great time viewing it (consume). Where does producer end and consumer begin? We are all prosumers, especially since the computer age and the Internet evolved.
Back to the point of our JavaScript graphics overview: plain JavaScript to create graphics is more fun and interesting than using frameworks and libraries with JavaScript, but the latter are faster and easier to use, except when they need HTML5, which a third of the computers won't do, but all computers will be able to use our scripts.
In addition to the many chart scripts and graphics scripts we offer which are linked to above, we offer a free grab and drop script (NOT drag and drop). What need is there for a grab and drop script like Grab and Drop, Not Drag and Drop? Here are three applications that make extensive use of our grab and drop code: Make Pie Chart from User-Inputted Data and Make Pie Chart from CSV Data and Make Pie Chart from MySQL Table Data. It turns out that even though it isn't that hard to make a pie chart, labelling it is anything but straightforward. There are so many factors: how many labels (which corresponds with how many elements are being charted), how many words per label, how large the font is, what position around the circle each label is, and what to do when labels try to overlap. There is a reason that the chart aspect of applications like Excel give users drag and drop capabilities when it comes to labels—especially pie chart labels. A human eyeballing a chart and adjusting label placements is simply more effective than any algorithm. So algorithms take their best shot at labelling effectively, and then humans take over for the final adjustments. Whether drag and drop or grab and drop, a script like Grab and Drop, Not Drag and Drop is essential for some types of apps, and the three pie chart script tutorials mentioned above let you experience why. Click move click is much easier than click drag click, which most apps do. See for yourself!